Product Description
Description
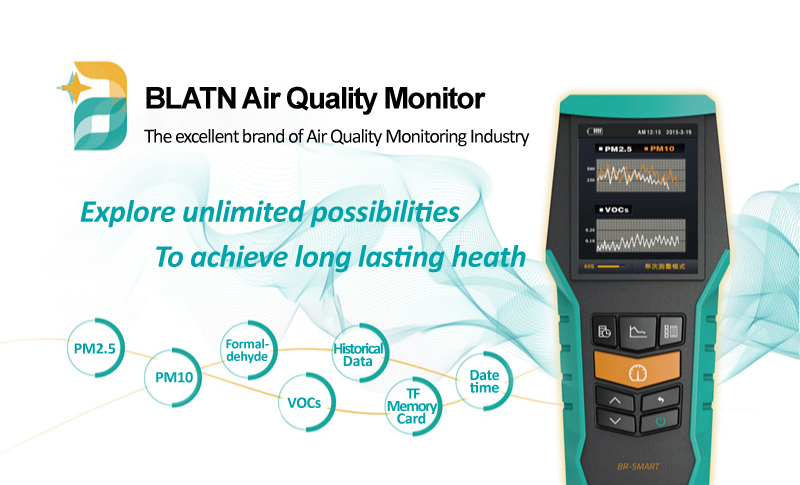
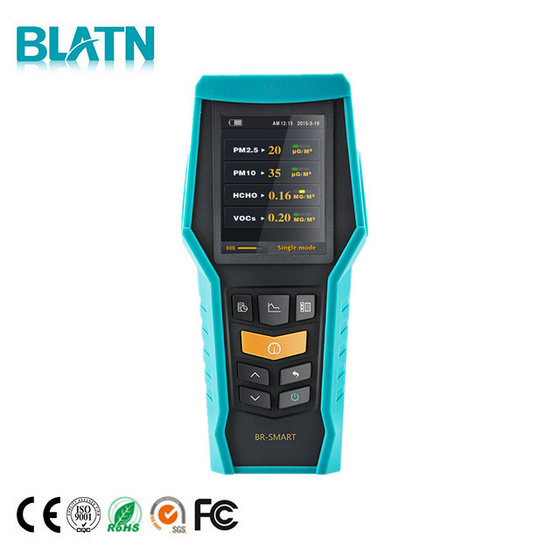
BR-SMART-121 Measure: PM2.5 & PM10
BR-SMART-126 Measure: PM2.5, PM10, Formaldehyde & VOCs
BR – Smart series is a real-time air quality monitoring instrument used to detect air quality of indoor environment.
Smart series monitor use high-precision sensor and translate the pollutant concentration in the air directly into intuitive data to provide air quality monitoring information and effective protection for your family health.
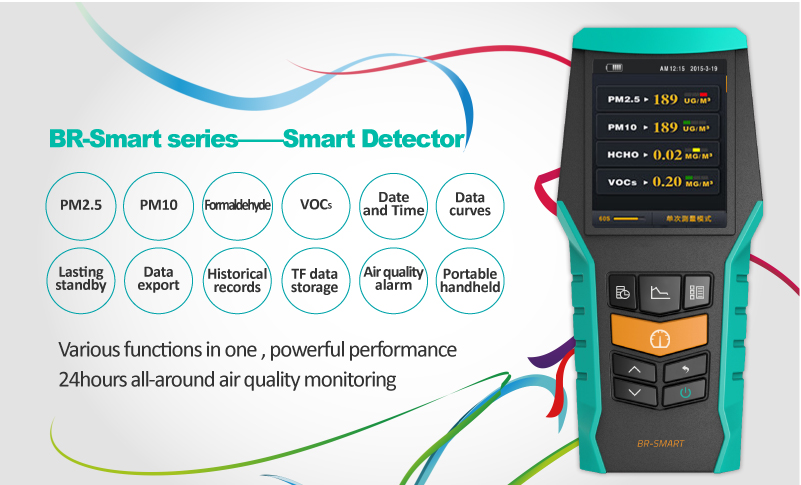
SMART series can detect a variety of pollutants, including PM2.5, PM10, formaldehyde, VOCS etc.
More set up a professional man-machine interface interaction, accurate display of data change
curve, external TF memory function, maximum support 8G TF card, storage capabilities more powerful, can clearly monitor the air.
Main Function
- PM2.5 / PM10
- Formaldehyde
- Date & time display
- Data curves
- Data export
- Historical records
- TF card storage
- Air quality alarm
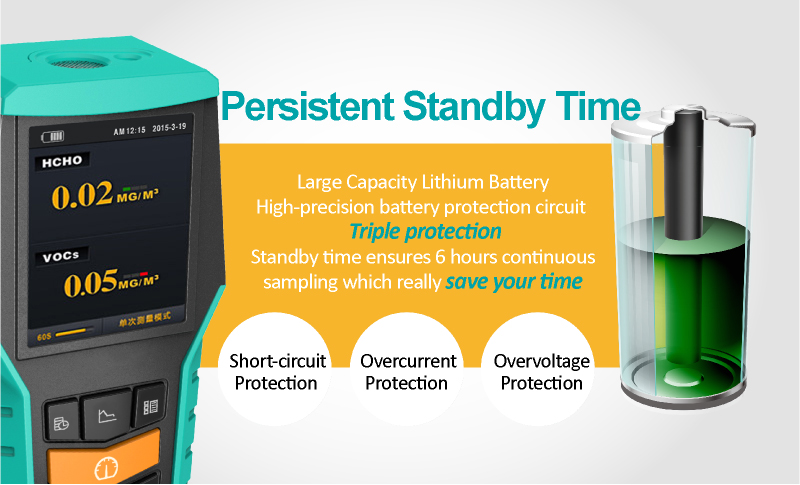
- Lithium battery + USB charge power supply
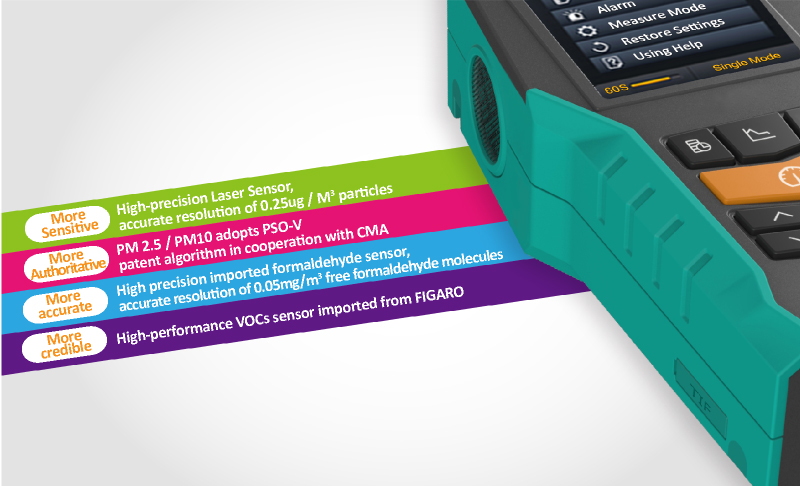
More Sensitive—High-precision Laser Sensor, accurate resolution of 0.25ug / M3 particles
More Authoritative—PM 2.5 / PM10 adopts PSO-V patent algorithm in cooperation with CMA
More accurate—High precision imported electrochemical formaldehyde sensor, accurate resolution of 0.01mg/m3 free formaldehyde molecules
More credible—High-performance VOCs sensor imported from FIGARO
Feature
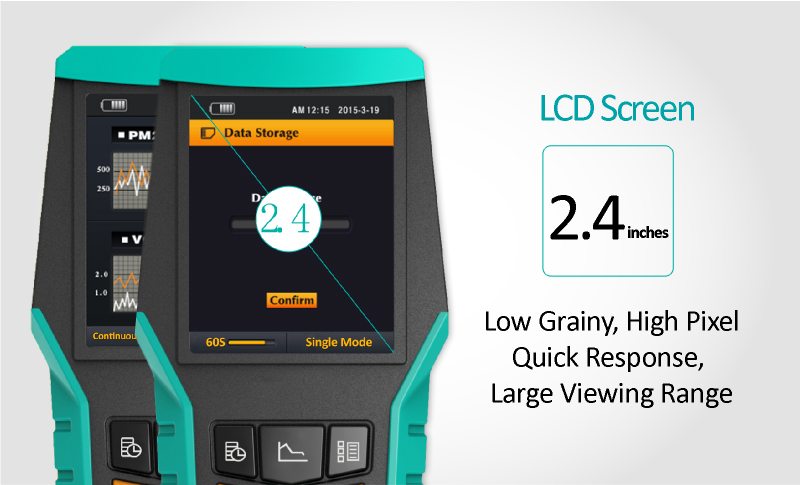
1. 2.4-inch large screen, grainy low, high pixel, large visual range
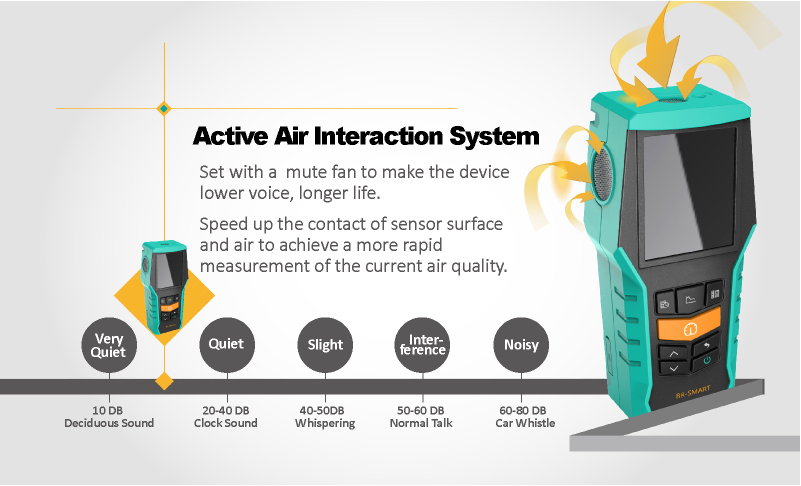
2. Active air interactive system, silent fan, lower noise, longer life expectancy
3. Sampling work more than 10 hours, long standby 30 days without charging
4. Accurate data curve drawn, the trend of air changes at a glance
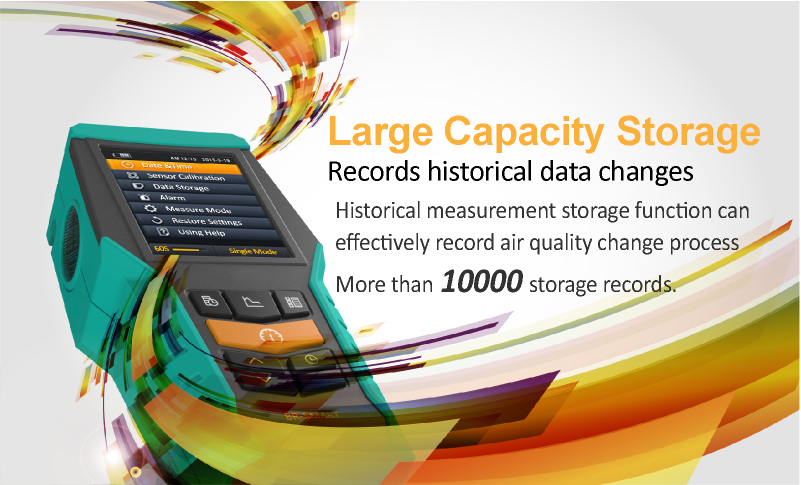
5. TF external memory card expansion, can store up to more than 10,000 records
6. Dimensions: 65×140×40mm Weight: 220g


What is PM?
PM is short for “particulate matter”. It refers to particles found in the air, including dust, dirt, soot, smoke, and liquid droplets. Particles can be suspended in the air for long periods of time. Many man-made and natural sources emit PM directly or emit other pollutants that react in the atmosphere to form PM. These solid and liquid particles come in a wide range of sizes. Some particles are large or dark enough to be seen – like soot or smoke. Others are so small that individually, they can only be detected with an electron microscope.
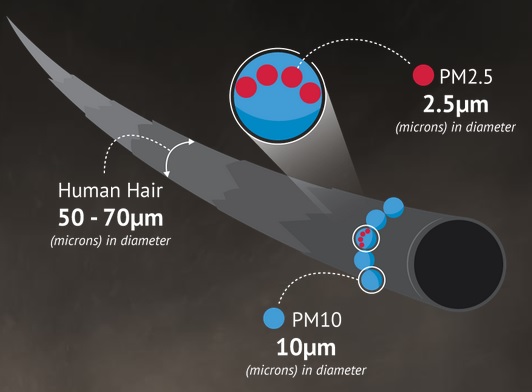
What is the difference between PM2.5 and PM10?
PM is usually measured in two size ranges: PM10 and PM2.5.
PM10 refers to particles with diameters that are less than or equal to 10 microns in size (a micron, or micrometer, is one-millionth of a meter), or about 1/7 the diameter of a human hair.
PM2.5, also called “fine particulates,” consists of particles with diameters that are less than or equal to 2.5 microns in size. That’s about 1/30 the diameter of a human hair. PM2.5 is a more serious health concern than PM10, since smaller particles can travel more deeply into our lungs and affect your health.
Where does PM2.5 come from?
Fine particles are produced from all types of combustion, including motor vehicles, power plants, residential wood burning, forest fires, agricultural burning, volcanic eruptions, dust storms and some industrial processes. Some are emitted directly into the air, while others are formed when gases and particles interact with one another in the atmosphere.
Why is it so dangerous?
The health effects of PM10 and PM2.5 are well documented. Over-exposure to PM increases the risk of heart and lung illnesses and can reduce an individual’s lifespan. Alarmingly, there is no evidence of a safe level of exposure or a threshold below which no adverse health effects occur.
Numerous studies have linked long-term particle pollution, especially PM2.5, with significant health problems including:
- Increased respiratory symptoms, e.g. irritation of the airways, coughing or difficulty breathing
- Decreased lung function
- Aggravated asthma
- Development of chronic respiratory disease in children
- Development of chronic bronchitis or chronic obstructive lung disease
- Irregular heartbeat
- Nonfatal heart attacks
Premature death in people with heart or lung disease, including death from lung cancer Short-term exposure to particles (hours or days) can:
- Aggravate lung disease causing asthma attacks and acute bronchitis
- Increase susceptibility to respiratory infections
- Cause heart attacks and arrhythmia’s in people with heart disease
Even if you are healthy, you may experience temporary symptoms, such as:
- Irritation of the eyes, nose and throat
- Coughing
- Chest tightness
- Shortness of breath
How can I find out about PM2.5 level in my community?
Unfortunately, unlike neighboring Singapore and even Indonesia, Malaysia does not publish any PM2.5 data.
While the Department of Environment (DOE) Malaysia releases its Air Pollutant Index (API) readings taken at 52 stations hourly, the air pollutants measured do not include PM2.5. The five pollutants currently measured are ozone (O3), carbon monoxide (CO), nitrogen dioxide (NO2), sulphur dioxide (SO2) and PM10. The pollutant with the highest concentration is then taken as the API reading and this is usually PM10.
The DOE in its website said it is in the midst of finalizing the new Malaysian Air Quality Guidelines to include the standard limit of PM2.5 in the ambient air based on World Health Organizations (WHO) 2006 guidelines. “Subsequently, we will need to come up with a PM2.5 Air Quality Index System and data integration with the existing system in our Environmental Data Centre (EDC) prior to including it in our API calculation.” Adoption is likely to happen by end-2016.
How does our API readings compare with, say Singapore?
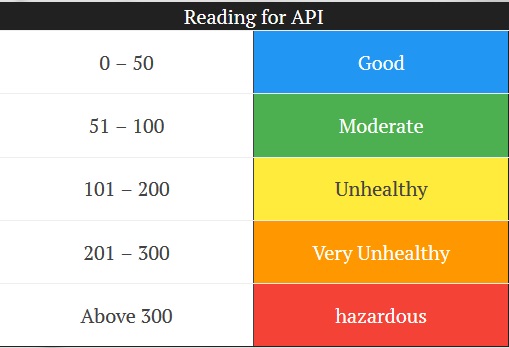
Singapore uses the PSI (Pollutant Standards Index) which measures what Malaysia’s API does, plus PM2.5. Both Malaysia’s API and Singapore’s PSI are standards developed for measuring pollutants by the United States Environmental Protection Agency (USEPA) and have similar categories — a reading of 0-50 is considered ‘good’, 51- 100 ‘moderate’, 101-200 ‘unhealthy’, 201-300 ‘very unhealthy’. A reading above 300 is ‘hazardous’. But a straightforward comparison between them will be like comparing apples to oranges.
As Malaysia does not measure PM2.5, its API shows substantially lower readings. This creates a more positive but ultimately illusory picture of the state of our nation’s air quality.
Related Products